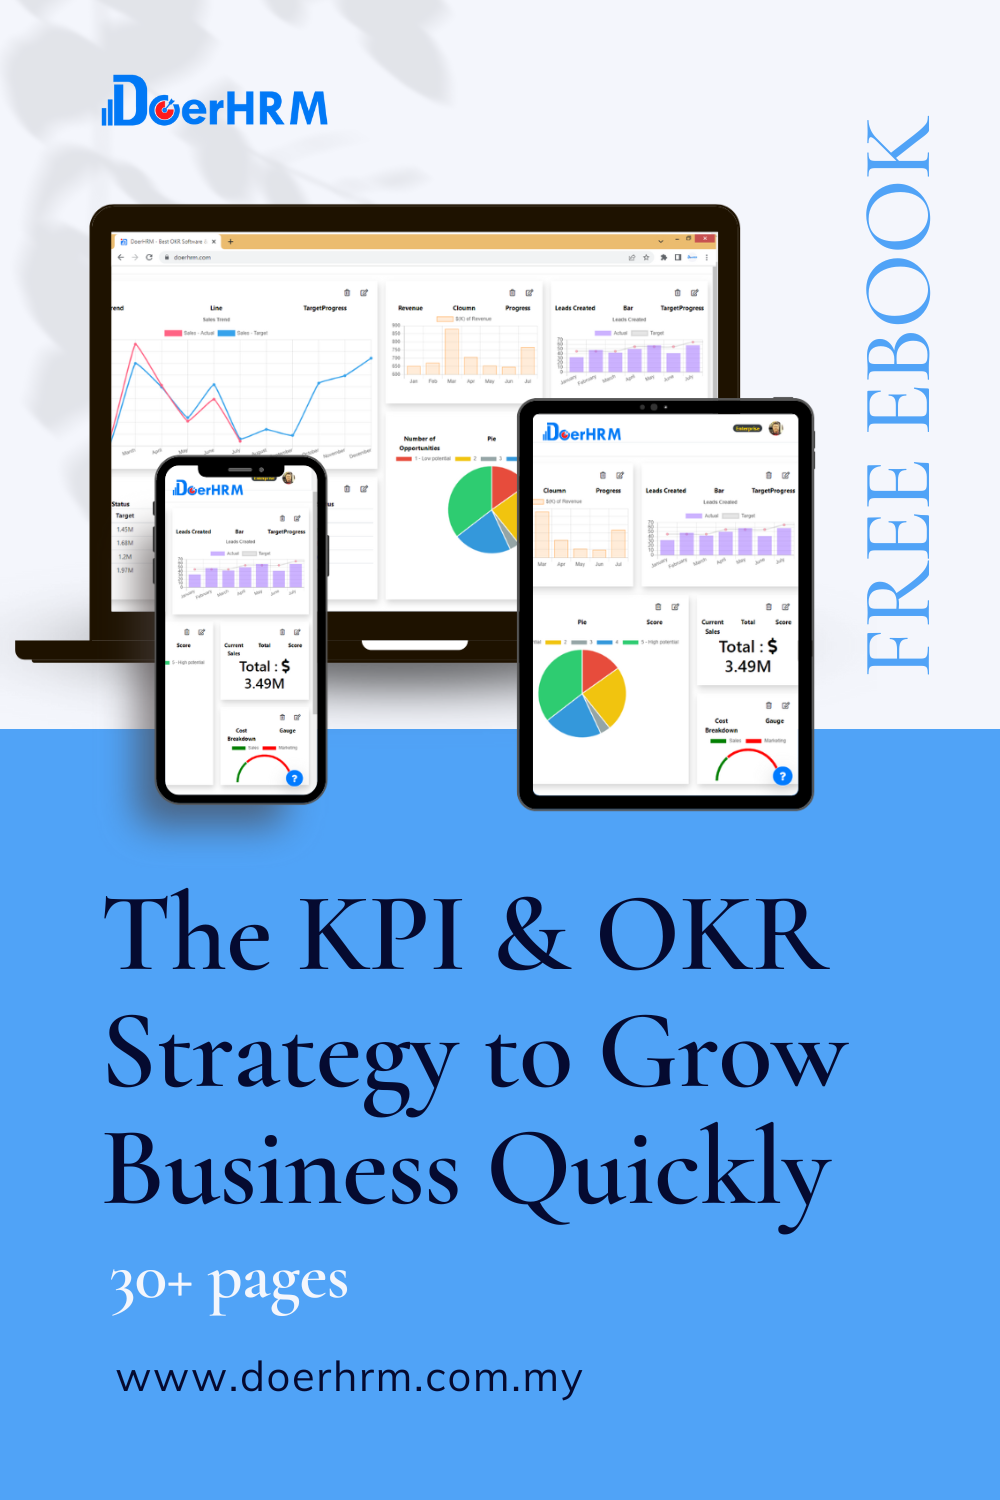
One prevalent error observed in sales teams is the incorporation of an overwhelming array of metrics in their key performance indicator dashboards.
This approach tends to encompass everything, including unnecessary elements, resulting in a cluttered view that hampers clarity and understanding.
When selecting which indicators to feature in your sales dashboards, it’s essential to consider your target audience. This ensures a more effective construction of the dashboards. In the upcoming video, we’ll explore strategies for enhancing your sales KPI dashboards and outline the key performance indicators that should be included.
What Exactly are KPI Dashboards for the Sales team?
Key performance indicators (KPIs) for sales are metrics that are used to monitor and assess the performance of sales teams as well as all sales activities that are carried out. If you are in charge of sales, using key performance indicators will assist you in increasing the efforts of your sales team so that you can meet your sales targets, goals, priorities, and other objectives.
When it comes to key performance indicators (KPIs), less is more; for this reason, it is essential to determine and measure just the most important sales KPIs and metrics for your company.
If you choose the proper key performance indicators (KPIs), they will give you unique insights into the performance of your team and help you uncover chances for training, and problems with pipelines, maximise profit, improve your sales process, and optimise your daily sales techniques. On the other hand, choosing the incorrect ones can simply result in financial loss.
In order for sales managers to get the most out of a sales dashboard, they need to avoid assessing the incorrect success indicators—ones that don’t really have any bearing on how well the company is doing. A key performance indicator (KPI) for sales should be relevant, measurable, and actionable. This means that you should be able to improve your results by monitoring the trends displayed on your sales KPI dashboard and that you should also have the ability to act upon information as it becomes available in real-time.
Most Common Sales KPI Dashboards
As a sales leader, it is essential to have a solid understanding of which sales KPIs and metrics are important to monitor and why they are important in order to get the most out of your team. Now, let’s take a look at four of the most common key performance indicator sales dashboards that are used in a range of sectors.
Sales and Marketing Dashboard
You may use separate solutions to manage your marketing and sales dashboards, or you can use one platform to manage both.
Your marketing team may use tools to produce organic contacts on your website, then nurtures those contacts to make them qualified for sales, and then takes them from the MQL database into the SQL database.
This method will save a significant amount of time and make it much simpler for both the Marketing and Sales teams to collaborate on achieving shared objectives. Everything becomes obvious and transparent between sales and marketing, and both of your teams work together to achieve more results, consistently. In fact, both of your teams will work together to produce greater results.
Sales and marketing dashboard may also include:
- Average Length of Customer Lifecycle
- Average Revenue Per Account
- Cost Per Acquisition
- Cost Per Lead
- Customer Lifetime Value (CLV)
- Customer Retention Rate
Sales Pipeline Dashboard
The Sales Pipeline Dashboard is an irreplaceable sales KPI dashboard that will provide your company with a clearer perspective on the progress your company is making by providing a detailed analysis of growth metrics such as open leads, lead sources, lead conversion, and total pipelines by stage. This will allow your company to make more informed decisions regarding the future of your company.
The sales pipeline dashboard performs an analysis and determines whether or not we have sufficient volume in our pipelines to assist in achieving our target. It also helps detect pipelines that are not working as expected. You will be able to take preventative measures by ensuring that your teams fulfil expectations and achieve the appropriate outcomes by generating visual reports from this dashboard and using those findings to take action.
Executive Sales Dashboard
An executive sales dashboard is used by a significant number of larger marketing consultancies and agencies. This is helpful since it provides a high-level picture of the founders, CEOs, and C-level executives of the company.
The executive sales KPI dashboard is the most essential sales KPI dashboard because it provides an overview of the sales performance of your organisation. This makes it simpler to build new strategies that are both efficient and successful. You may examine the variations in customer behaviour and purchasing patterns between your older marketing initiatives and your more recent ones by comparing them side by side.
Because of this, it is possible for your sales and marketing teams to work together to design a plan that not only draws in prospective clients but also increases the number of clients who make a purchase.
The following key performance indicators (KPIs) may be seen on the executive sales dashboard:
- Future forecasts
- Charts illustrating both positive and negative trends
- Sales comparisons (monthly and yearly)
- The typical rate of conversion
These measurements are essential for determining whether or not a sales effort will be profitable and successful. Your employees will be able to make choices that are more informed as a result, which will have a beneficial influence on our sales. Your objectives at the year’s end might be accomplished far earlier than expected using this.
Sales Performance Dashboard
The effectiveness of your sales efforts may be monitored and tracked with the assistance of this very effective dashboard, which will be of use to your managers and executives.
Using this dashboard, you will be able to efficiently monitor the progress that has been made by our sales department as well as each of our sales reps. It gives a holistic picture that allows you to make strategic choices to optimise your sales cycle and sales funnel by seeing every component of your sales portfolio and hence visualising every aspect of your sales portfolio.
The following is a list of critical metrics that you may want to include in your KPI dashboard for sales performance:
- Average weekly sales revenue
- Customer Acquisition Cost
- Lead Conversion Ratio
- Number of new customers acquired
- Sales Cycle Length
- Sales target
This will provide you with valuable information about the success of your team over a certain sales period and will assist you in improving your sales operations. If you have these indicators close at hand, you’ll be able to increase the efficiency of your sales.
Conclusion
When assessing and evaluating sales performance, there exists a vast array of potential key performance indicators (KPIs) to consider. However, it’s crucial to emphasize the term “KEY.”
Focus solely on monitoring and collecting the KPIs for sales that furnish pertinent insights and are amenable to enhancement. Exercise discernment in selecting the data showcased on your dashboard, incorporating only those indicators integral to your business narrative. By doing so, you can effectively achieve your objectives and enhance your business’s profitability.


